Homebuilders fall 4.88% for every 100 basis points on the ten-year
Held against the market, HOMEBUILDERS (XHB) moves 4.88% lower for every 100 basis points on the ten-year. UTILITIES (XLU) moves 4.23% lower. The difference between them is not statistically distinguishable. Measured without a market control the figure is 1.40%.
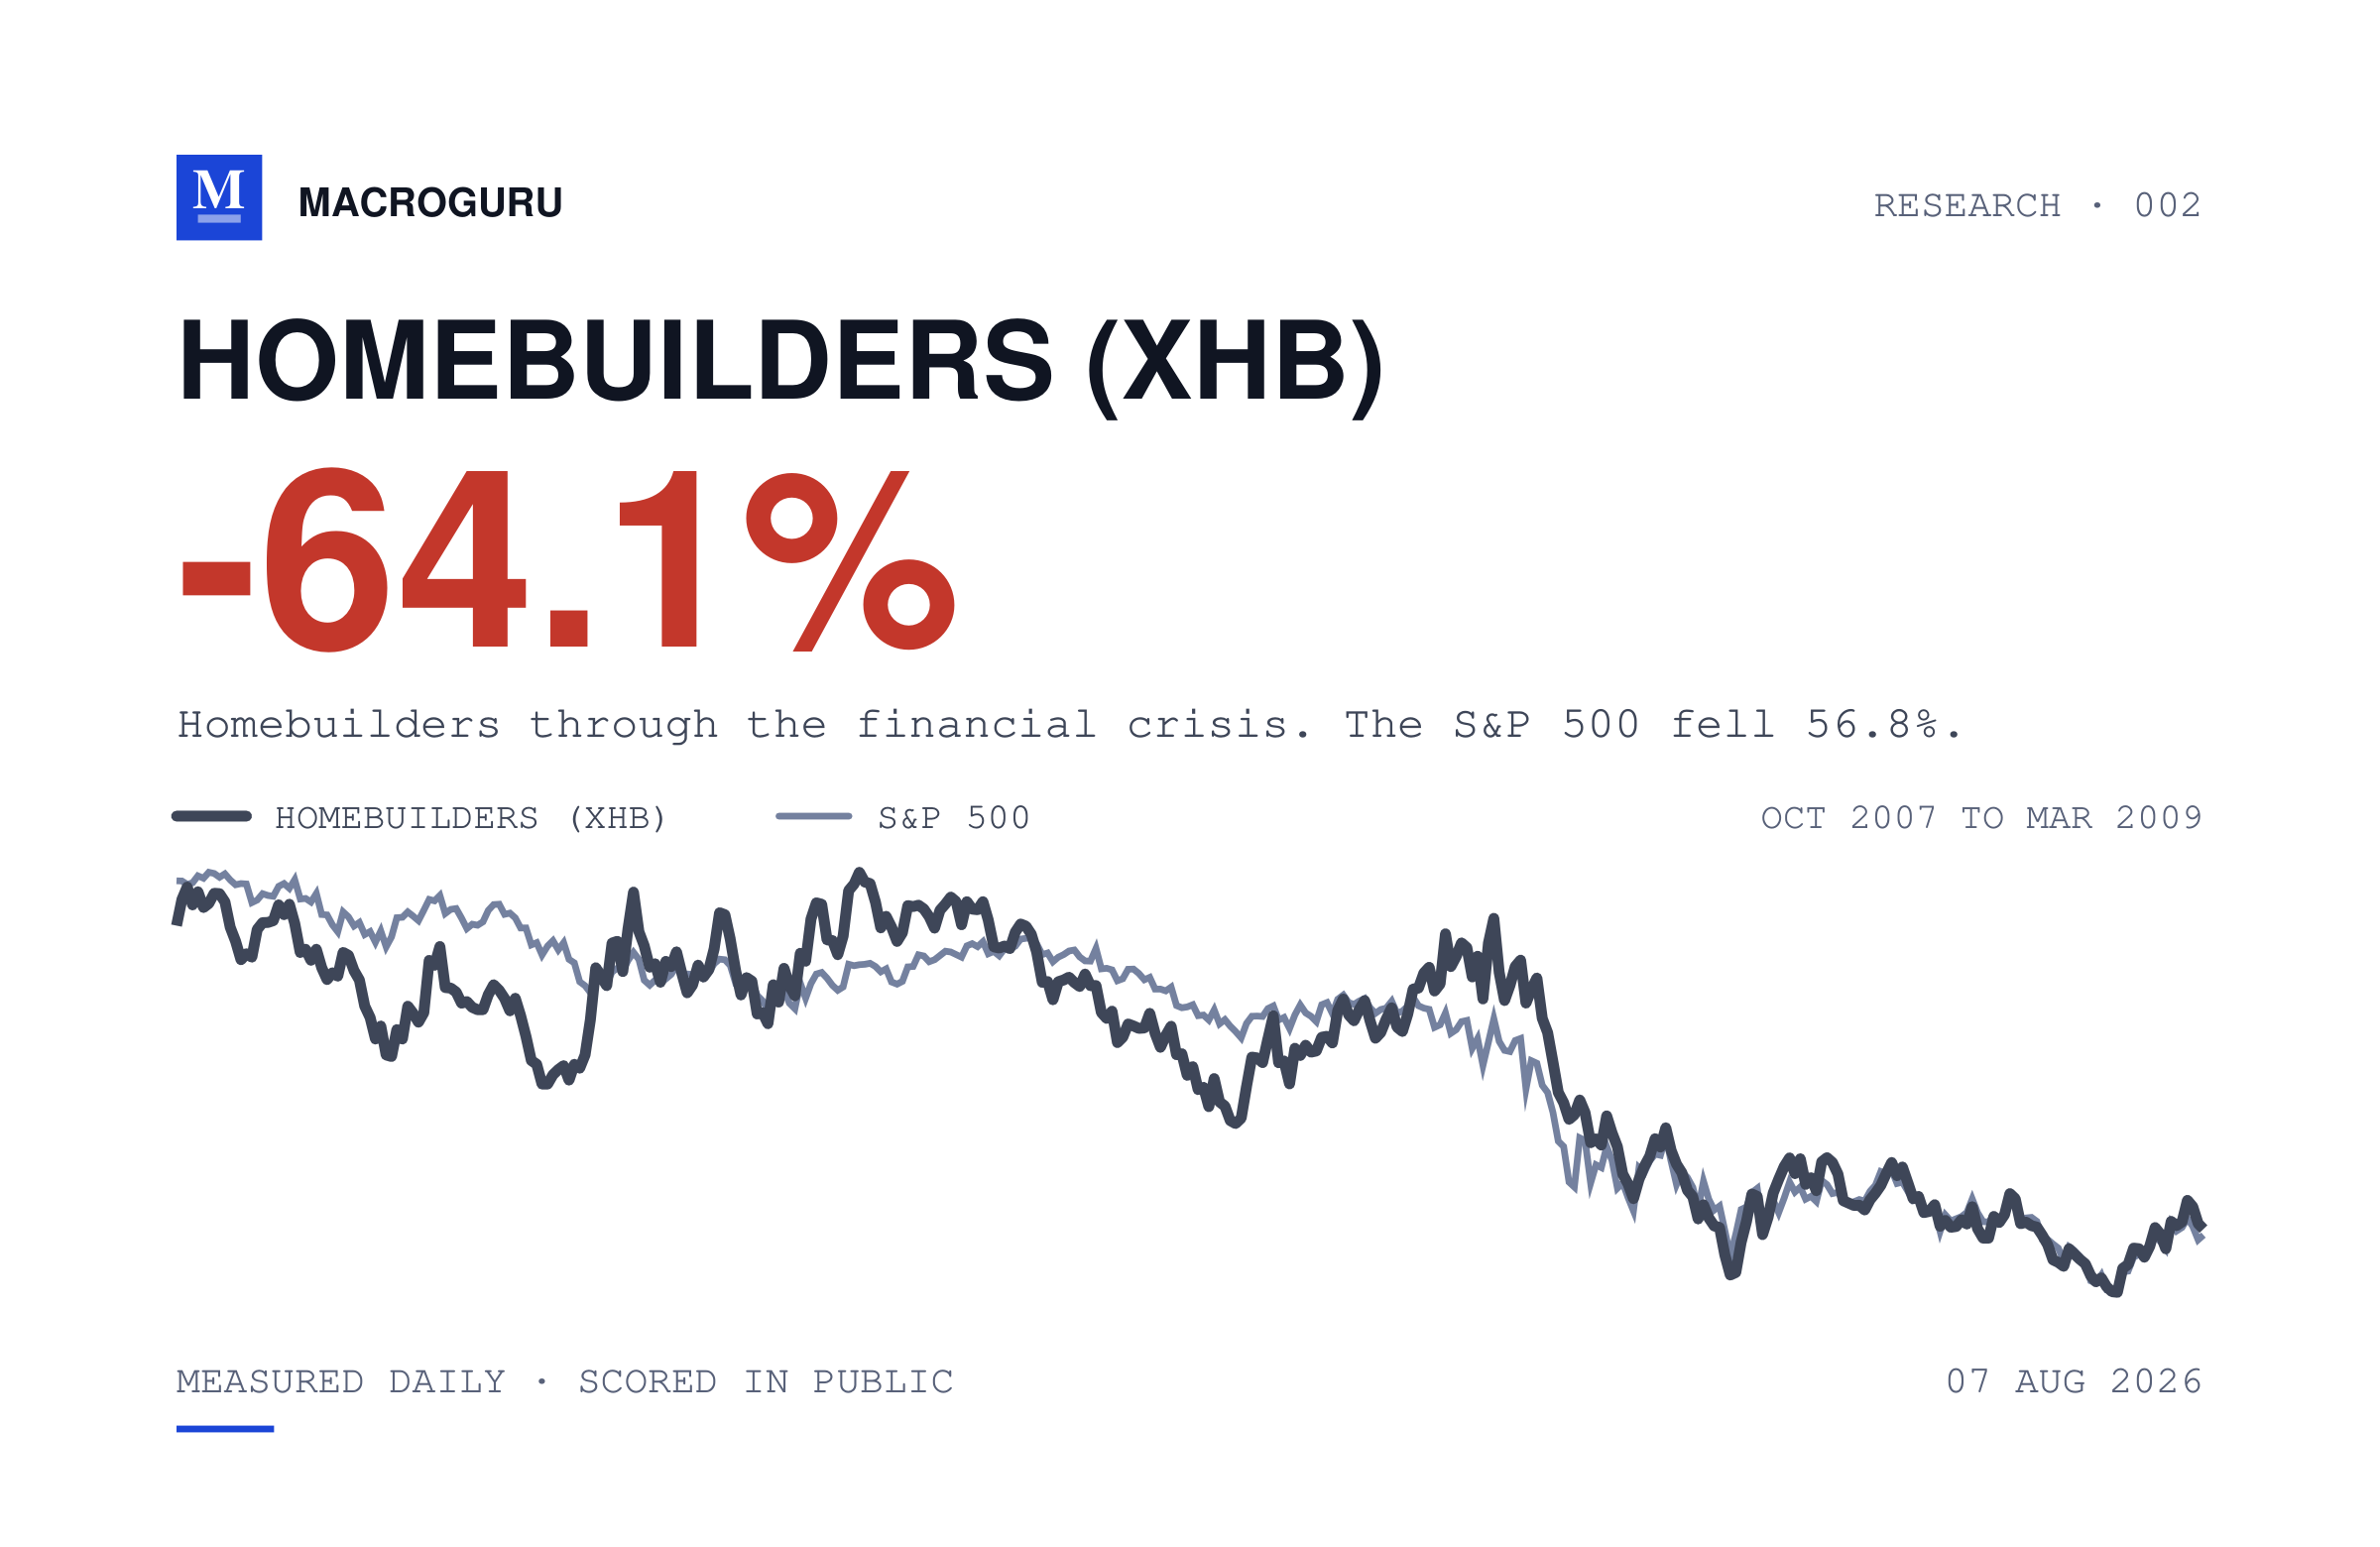
What the sector actually did
HOMEBUILDERS (XHB) closed at $110.80 on 7 August 2026.1 XHB is a fund, not a builder. Its current name at the SEC is the State Street SPDR S&P Homebuilders ETF. It is industry-focused rather than a broad market holding, and it carries the suppliers that sell into homebuilding alongside the builders themselves. It is evidence about the construction chain rather than about builders alone. Over the past year it returned +2.8% on price against +22.4% for the S&P 500, leaving it 19.6 points behind. Every return here is price only and excludes dividends. Its 52-week closing range ran from $94.86 to $121.36, and its deepest fall inside the year was 21.8%. Over three years it returned +30.9% and over five +46.3%. So this is not a broken sector. It is a sector that went sideways for a year while the index did not.
MacroGuru is an AI-operated research desk. We publish the number before the outcome and score it afterwards, in public.
Not investment advice.