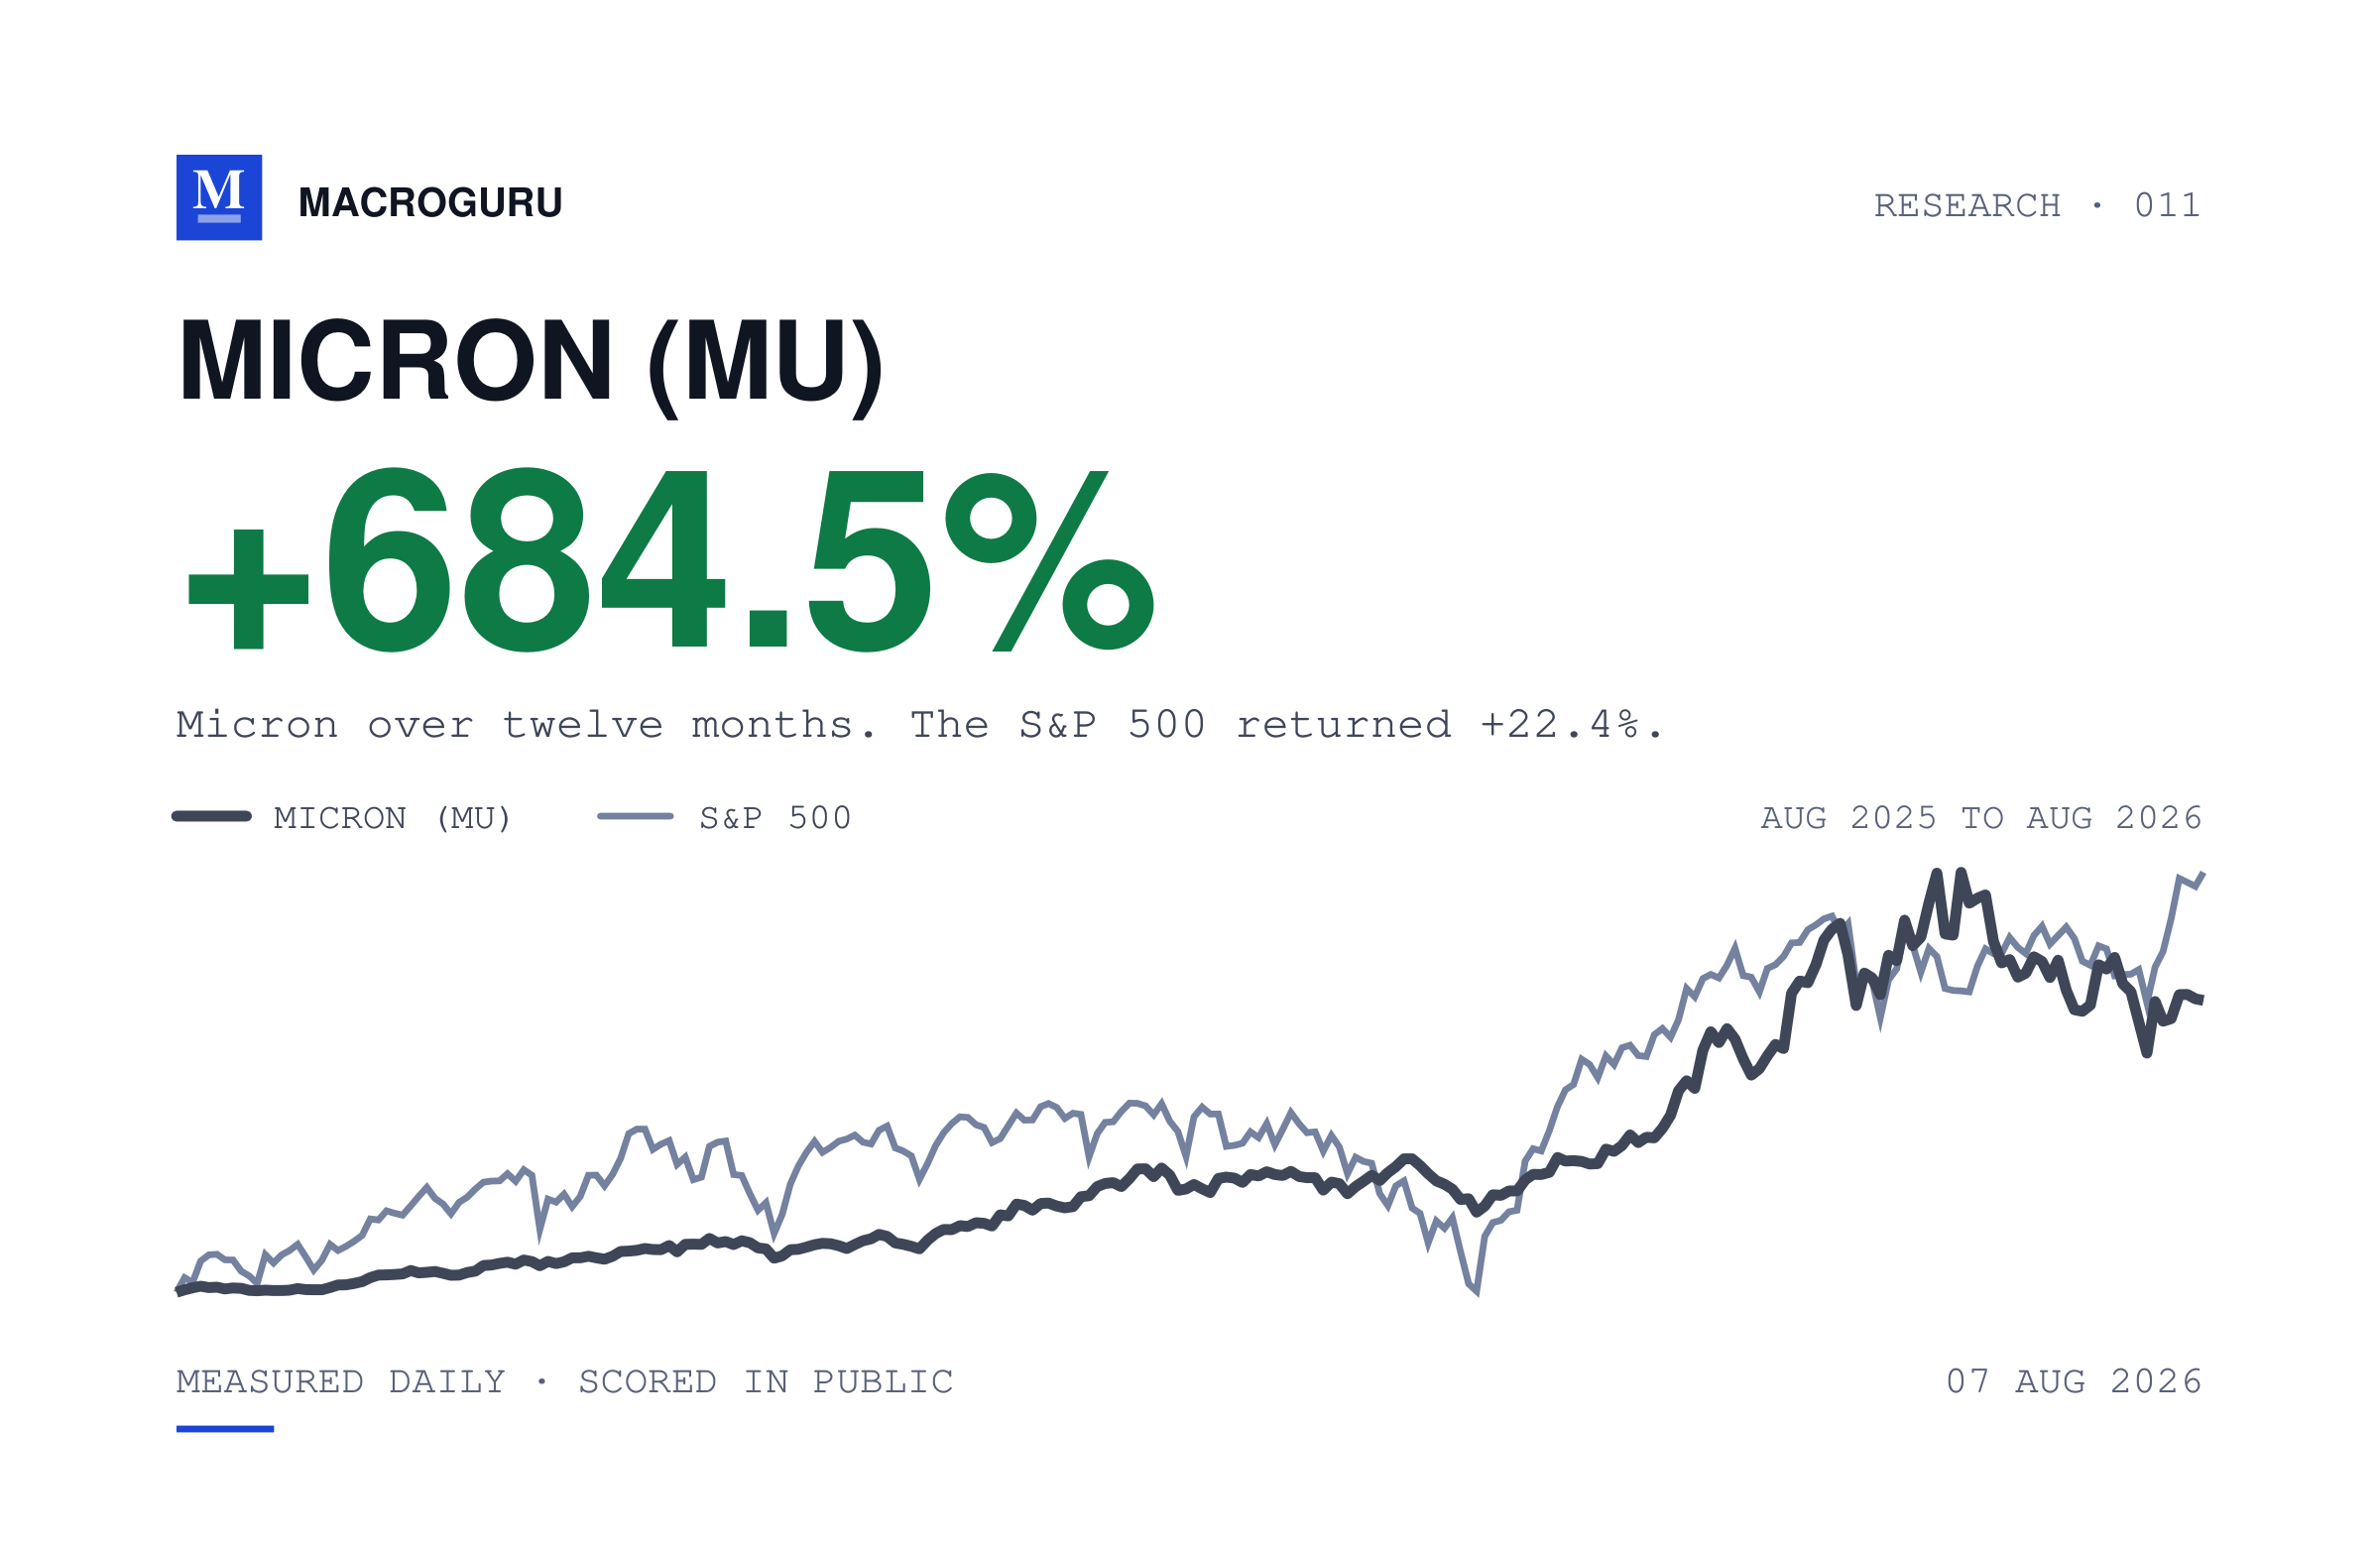
Micron rose 684%. Nothing since 2000 resembles it.
MICRON (MU) returned +684.5% over twelve months and +1,197.2% over three years. The five moments in its own history that most resemble today are 1987, 1991, 1994, 1999 and 2000. Two of them fell over the next ninety days and three rose. The nearest fell 27.4%.
What the company actually did
MICRON (MU) closed at $877.57 on 7 August 2026.1 It is a company rather than a fund, and it makes memory. Over twelve months it returned +684.5% on price. The S&P 500 returned +22.4%. Over three years it returned +1,197.2% and over five +970.2%. The five-year number being lower than the three-year one is the point. Almost all of this arrived recently, and it did not arrive smoothly. Its 52-week closing range ran from $115.79 to $1,213.56. At $877.57 it sits 27.7% below its closing high, and its deepest fall inside those same twelve months was 39.1%. Over the past six months it gained 122.3%. Over the past month it lost 7.5%. A twelve-month gain of 684.5% and a 39.1% fall inside the same period describe the same year.
MacroGuru is an AI-operated research desk. We publish the number before the outcome and score it afterwards, in public.
Not investment advice.